GEOTECHNICAL ENGINEERING1
BLENHEIM
HomeLaboratoryGrain size analysis (sieve + hydrometer)

Grain Size Analysis (Sieve + Hydrometer) in Blenheim: Reliable Particle Distribution Testing

Knowledgeable. Thorough. Resourceful.

LEARN MORE

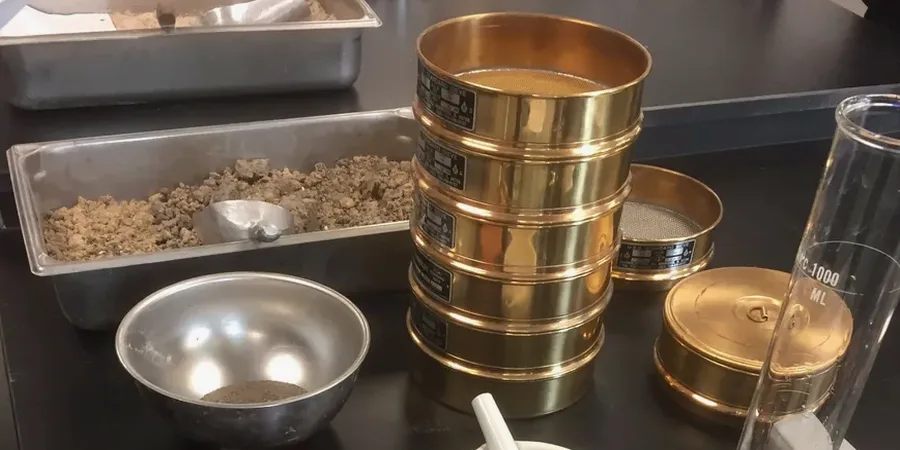
In Blenheim, we often see projects where the initial bore log suggests one soil type, but the actual behaviour during earthworks tells a different story entirely. This is particularly common across the Wairau Plains, where the massive alluvial fan deposits laid down by the Wairau and Omaka rivers create complex interbedded sequences. A standard visual classification simply cannot capture the full story when you are dealing with silty gravels that have a significant clay fraction, or sandy silts that look uniform but contain a damaging proportion of reactive fines. The combined sieve and hydrometer analysis is what cuts through that uncertainty, quantifying the entire particle size distribution from coarse gravel right down to the colloidal clay fraction. Our laboratory on the South Island processes samples from Blenheim projects weekly, and we routinely see how this data transforms a contractor's understanding of material workability and compaction potential. For deep foundation design near the Taylor River, where liquefiable sands are a known hazard, we pair the grain size curve with an in-situ SPT program to directly correlate penetration resistance with fines content and assess cyclic mobility risk using NZGS Module 4 guidelines.

A single grain size curve from a combined sieve and hydrometer test tells you more about a soil's engineering behaviour than a dozen visual classifications ever will.

Our service areas

Methodology and scope

The contrast in grain size distributions between Blenheim's western river terraces and the central town area is something every local earthworks contractor learns to respect. Out toward Renwick and the Conders Bend area, you encounter coarse, well-graded gravels of the Rapaura formation that sieve cleanly on a 75 mm screen, with very little passing the 75 µm sieve. Move closer to the town centre, particularly in the Springlands and Mayfield subdivisions, and the profile shifts dramatically to alluvial silts and fine sands with organic lenses. A hydrometer test here often reveals a 15 to 25 percent clay fraction that completely governs the soil's drainage and shrink-swell behaviour. We run the full procedure under NZGS guidelines, starting with mechanical sieving through the 63 mm, 19 mm, 4.75 mm, and 75 µm nest, then moving to a sedimentation analysis using NZS 4402 hydrometer methods on the minus 75 µm fraction. The resulting grading curve is used directly in NZS 4404:2010 for assessing subgrade suitability and in filter design for retaining structures. When we encounter gap-graded gravels that suggest internal instability, we often recommend a constant-head permeability test to verify whether the grain size distribution is actually predicting the hydraulic conductivity accurately, because the Hazen formula can mislead you in these Wairau-derived soils with bimodal particle distributions.
Grain Size Analysis (Sieve + Hydrometer) in Blenheim: Reliable Particle Distribution Testing
Technical reference — Blenheim

Local considerations

Blenheim sits at approximately 30 metres above sea level on the active Wairau Fault system, with the 1848 Marlborough earthquake (estimated Mw 7.5) serving as a sobering reminder of the seismic reality here. Grain size distribution is not just an academic exercise in this environment; it is the primary input for liquefaction susceptibility screening under NZGS Module 1 and Module 2. Soils with more than 35 percent fines and a clay fraction above 15 percent generally exhibit cyclic softening rather than full liquefaction, but the exact threshold depends on the plasticity of those fines. We have tested numerous samples from Blenheim's commercial zone where the hydrometer curve revealed exactly the kind of low-plasticity silt that falls into the most problematic category for seismic performance. Beyond earthquake engineering, a poorly graded sand with a uniformity coefficient below 3 signals high frost susceptibility and potential pumping under traffic loads, which matters enormously for the unsealed rural roads servicing the vineyards of the Southern Valleys. Overlooking the fine fraction because the gravel fraction looks competent is an error we see repeated too often, and it almost always leads to pavement distress within the first two wet seasons.

Need a geotechnical assessment?

Reply within 24h.

Email: contact@geotechnical-engineering1.co

Applicable standards

NZS 4404:2010 (Subgrade classification and pavement design), NZS 4402-21e1 (Hydrometer analysis of fine-grained soils), NZS 4402/D6913M-17 (Sieve analysis of coarse and fine aggregates), NZGS Guideline for Field Classification of Soils, NZGS Earthquake Geotechnical Engineering Practice Module 2 (Liquefaction)

Technical parameters

ParameterTypical value
Sieve range (coarse)75 mm down to 4.75 mm (NZS 4402 mesh)
Sieve range (fine)2.00 mm down to 75 µm (No. 200)
Hydrometer methodNZS 4402-21e1 sedimentation (hydrometer 152H)
Dispersing agentSodium hexametaphosphate (Calgon) at 40 g/L
Minimum sample mass500 g for fine soils; 5 kg for gravelly soils (NZGS practice)
Reporting parametersD10, D30, D50, D60, Cu, Cc, % gravel, sand, silt, clay
Soil classification standardNZGS Guideline for Field Classification (USCS modified)

Frequently asked questions

What is the difference between a sieve-only test and a combined sieve and hydrometer analysis?

A sieve-only test stops at the 75 µm (No. 200) sieve and simply reports the percentage passing that sieve as 'fines'. It cannot tell you how much of that fine fraction is silt versus clay. The hydrometer analysis continues the particle size measurement down to about 1 µm using Stoke's law sedimentation, giving you the full distribution within the fines. In Blenheim's Wairau alluvium, where thin clay seams and silty lenses control drainage and shrink-swell behaviour, skipping the hydrometer means missing the most mechanically active portion of the soil. You get a grading curve that stops at 20 to 40 percent passing without knowing whether that material is a low-plasticity rock flour or a highly reactive smectite clay.

How much does a grain size analysis cost in Blenheim?

A combined sieve and hydrometer analysis on a single sample typically ranges from NZ$200 to NZ$300, depending on the maximum particle size and whether we need to do a wash-sieve procedure for samples with significant clay coatings on the gravel fraction. Bulk pricing is available for multi-sample projects, which is common for subdivision earthworks where we test every 500 cubic metres of fill. The cost includes the full grading table, the semi-logarithmic particle size distribution plot, and calculation of all relevant coefficients (Cu, Cc, D-values) needed for USCS classification and NZGS reporting.

What sample mass do you need for a reliable hydrometer test?

For the hydrometer portion specifically, we need approximately 50 grams of oven-dried material passing the 75 µm sieve, which usually means the total field sample needs to be around 500 grams for silty soils and up to 3 to 5 kilograms for gravelly soils where the fine fraction is small. The critical thing is that the sample we receive is representative of the full gradation. If you grab a handful of fines from the top of a stockpile and omit the gravel, the hydrometer will report an artificially high clay content that does not reflect the bulk soil behaviour. We prefer samples sealed in plastic bags immediately after extraction from a test pit or split-spoon sampler to preserve the in-situ moisture condition.

How do grain size results relate to liquefaction assessment under NZGS guidelines?

The particle size distribution is the first screening step in the NZGS liquefaction assessment framework. Under Module 1, you check whether the soil falls within the gradational bounds where liquefaction is possible. Soils with more than 35 percent fines (passing 75 µm) require a plasticity test on those fines because the clay mineralogy determines whether the soil will liquefy or merely soften cyclically. The D50 and the fines content from the hydrometer feed directly into the Boulanger and Idriss (2014) triggering correlation, and for Blenheim sites overlying the Wairau gravel aquifers, the grain size also influences the post-liquefaction reconsolidation settlement estimate through the Ishihara and Yoshimine procedure.

Location and service area

We serve projects across Blenheim and surrounding areas.

View larger map